Is Tony Abbott a Misogynist? Part II: Comments, Clarifications and Corrections
Well, my attempts to break down the Tony Abbott gender issue into simple, undisputable mathematics proved anything but uncontroversial. On my Facebook page, the comments came thick and fast, quickly turning my wall into rigorous debating forum. The post received so much interest that for a couple of days in a row last week, it came up as one of the top Google hits of searches for “Tony Abbott gender bias one woman cabinet” (although, as Roger Emerson cheekily pointed out, it was also the top Google hit for “David Smerdon misogynist”).
There was quite a lot of support for my post, but of course, those aren’t the most interesting comments…everyone loves controversy! Criticisms largely came in three categories: emotive, philosophical and mathematical. A brief summary follows, after which I offer a small correction to the statistical analysis.
Emotive
A small percentage of the comments fall into what can generously be termed “emotive” arguments – in other words, arguments based more on emotion than substance.
Some comments implied, directly or indirectly, that I was supporting or defending Tony Abbott’s sexism, with one commenter going so far as to dispute my own claims to promoting gender equality. Nothing could be further from the truth. I have for many years been active in my pursuit of gender equality, both in Australia and abroad, and I certainly would not call myself an Abbott supporter in any form. In fact, the main reason I imposed significance criteria ex-ante was to ensure that my own biases against Abbott didn’t massage the statistical results to suggest a gender bias that wasn’t there.
Furthermore, one of the driving factors for wanting to check the statistics is that I believe public criticisms in the media from feminists must not misrepresent the facts if their wielders truly want to further their cause. Gender equality is an emotion-charged topic and often provokes fiery reactions, but how can the voice of equality be trusted if it is found to have misrepresented, deceived or used false facts in the past? Proponents for change have to be especially careful in this regard, and I don’t think being factually careful is worthy of vilification from members of one’s own cause. As I said in response to one such comment, “Just call be Galileo.”
A further emotive criticism was that the analysis was irrelevant because it wouldn’t be understood by “about 99% of the population.” If this were true, I shudder to think about the future of science (as well as chess, making soufflés and speaking Swahili, come to mention it).
Philosophical
Elements of rational debate were employed by quite a few commentators seeking to invalidate the analysis. Two of my acquaintances pointed out that a prior belief that Tony Abbott is sexist would not be refuted by a statistical significance between 5% and 10%, and therefore his sexism could not be disproved. These and other comments led me to realise that the title of the article was a bit misleading. In the end, the analysis measures gender bias in the appointments; I make no comment on Abbott’s sexism per se, which is more of a personality assessment. However, the point about prior beliefs applies equally to gender bias in the Cabinet. If one believes beforehand that Abbott would choose a biased Cabinet, then the statistics do not disprove this belief, and thus it can be continued.
Quite a few others focussed on outside factors that could have confounded the analysis, such as ministerial and geographical quotas in the Liberal-National coalition – quotas I must admit I wasn’t aware of. Coupled with heterogeneity (in other words, other differences) in pre-selection, electorates, merit and experience of the candidates, etc, it was claimed that the analysis was not valid and did not disprove the gender bias.
My response to both of these criticisms is the same. Confounding factors only serve to reinforce that one cannot claim a gender bias in the appointments from the facts. These arguments use what is known as “Burden of Proof Reversal”, a cardinal sin in rational debate, but unfortunately a commonly employed one in politics and the mainstream media. The approach usually claims that something is true simply by stating that is cannot be proved it is not true. Preaching that the earth is flat in an age without astrological tools is one example.
However, in science as well as law, the proof should be on the claimant. If a man is accused of murder, the onus is on the accusers (or their representatives) to supply the evidence to support the claim. Such ‘presumption of innocence’ should also apply to public vilification in the media. In this case, the claim is that Tony Abbott exhibited gender bias in the Cabinet appointments, and the evidence supplied is the ratio of women to men – nothing more (this was the case in, for example, media reports by the ABC, the Australian, the Huffington Post and Adelaide Now, among others). The fuzzier the evidence, then, the weaker the claim, and therefore more shame to these media outlets, in my opinion. My statistical analysis is meant as a rational attempt to clarify the factual ‘evidence’ supporting the claims, and my conclusion is that, even with confounding variables excluded, the numbers don’t stack up.
Mathematical
Finally we turn to the real embarrassment of this addendum to the original post: My mathematics was wrong! My thanks to Dave Mitchell and Melissa Hogan (two of my friends studying at the Australian National University and who I met from ju-jitsu, of all things) for pointing out the error. [EDIT: Since writing this, Barry Cox has also made the same mathematical point in the comments.] While the mistake does alter the analysis such that the chances of gender bias seem lower than they actually are, the bias is small enough that there still isn’t quite enough evidence to support the claim against Tony Abbott – although it’s now pretty close.
Before we get into the technical aspects, the problem can be summed up succinctly as follows: I chose an approximation to the true probability that wasn’t appropriate and systematically biased the analysis against there being a gender bias. Oops. The story of the error is a little bit amusing. I came up with the idea to do this analysis while sitting in my local café with nothing more than a pen, some napkins and my archaic mobile phone. When I started, I quickly realised that calculating the true probability, as you’ll see below, involves multiplying such huge numbers that I had no chance to work things out. Adopting a binomial approximation, on the other hand, meant that I only needed to calculate a couple of powers (e.g. 0.78118), which my phone-calculator was capable of handling. I never bothered to check things afterwards, much to my shame.
In fact, as both Dave and Mel commented, the binomial approximation can only be used in what is known as ‘sampling with replacement’. In other words, by using this approximation I was essentially posing the question, “If there is a 22% chance of choosing a women and I choose one person at random, and repeat this exercise 18 times, what are the chances of picking no more than one woman?”
Sounds reasonable – but it’s not quite correct. Melissa and her colleague backed up their criticism by running Monte Carlo computer simulations that showed the chances of randomly selecting not more than one woman in the Cabinet are roughly 5.5%. At first I have to confess I was suspicious of this claim, but I should have known better – Mel is one smart cookie J I ran my own simulations and got the same result (and about 6.3% with Bronwyn Bishop removed). Annoyed with myself, I did the proper calculations analytically doing the heavy calculations on a computer and, lo and behold, I got 5.49% and 6.29% respectively. D’oh.
This is still outside the stipulated 5% level, though it’s obviously much closer. Given the burden of proof on those claiming a bias, and given that three chief excluded variables – experience, a male-heavy Nationals party and the higher weighting of Julie Bishop’s portfolio – all systematically seem to move the analysis away from a significant gender bias, I think the main result still holds. Some commenters claimed, correctly, that a proper data set could be constructed to include most of these variables and thus get more accurate results. However, given I’m not paid for my writings and also the heat I’ve taken for the analysis to date, I’m probably not going to do it…but we’ll see.
Barry Cox also made the point that it could be argued Tony Abbott had little choice but to choose his chief Cabinet ministers, and in fact he could only exercise choice in the more minor positions. That rules out Julie Bishop, Warren Truss, Joe Hockey and whoever else one deems a ‘forced appointment’ from the analysis. Barry shows that the subsequent revised analysis would show above a 95% probability of gender bias unless one assumes Tony Abbott had a say in less than eleven Cabinet ministers (or, as I showed, in all 18 of them). This is a really interesting result in my opinion. However, my analysis has steered clear of political arguments for the most part, and so I have continued to assume that Tony Abbott chose his entire Cabinet, but this stream of analysis is definitely worthy of more attention.
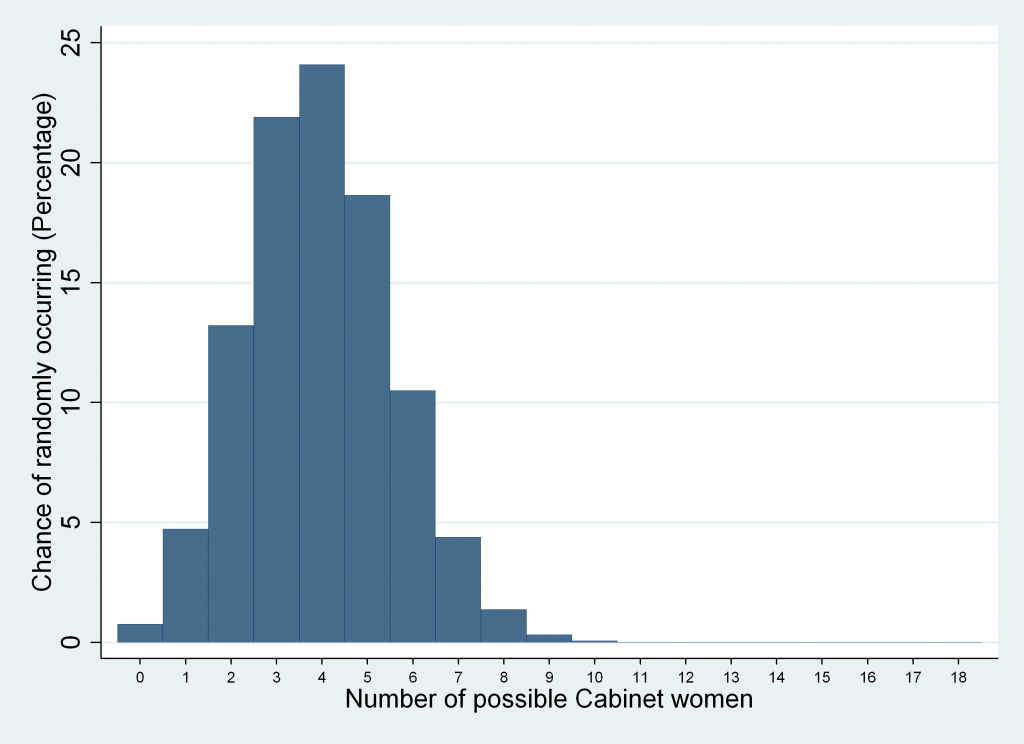
Here is the correct graph of the probabilities for each possible number of female Cabinet members.

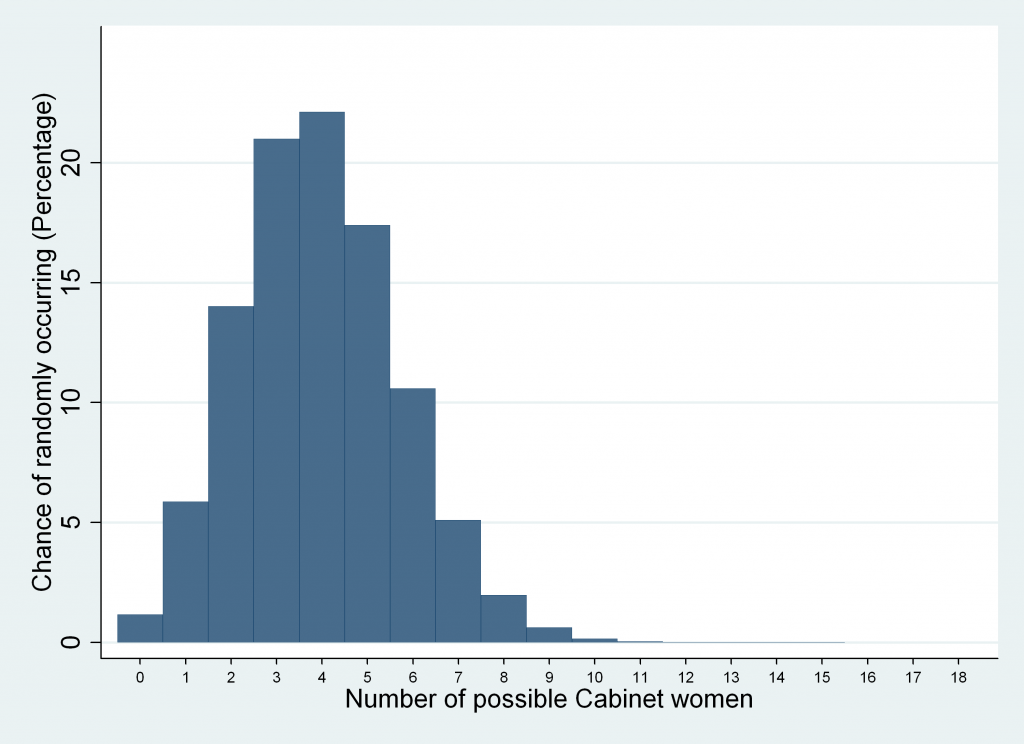
For comparison, here is the graph I previously supplied.

As you can see, they’re pretty similar, but if you look closely you’ll notice the correct graph is weighted higher in the middle section of the graph and weighted lower on the edges – so there is a marginally higher chance of more than women in the Cabinet.
What follows is the mathematical derivation of the correct probabilities. Feel free to skip it if it looks horrifying or hypnagogic.
(Note: In what follows, $latex n\choose k$ is the symbol for the so-called binomial coefficient. It is sometimes written as nCk or as $latex \frac{n!}{k!(n-k)!}$, which can be written in full as $latex \frac{n*(n-1)*(n-2)*\dots*2*1}{k*(k-1)*\dots*2*1*(n-k-1)*(n-k-2)*\dots*2*1}$. Looks scary, but a lot of numbers cancel out from the top and the bottom. For example, $latex 7\choose 3$ can be calculated as $latex \frac{7*6*5*4*3*2*1}{3*2*1*4*3*2*1}$, which simplifies to $latex \frac{7*6*5}{3*2}=35$.)
$latex Pr(No\quad more\quad than\quad 1\quad woman)$
$latex =Pr(0\quad women)+Pr(1\quad women)$
$latex =\frac{(\text{\#ways 18 men can be chosen})+(\text{\# ways 17 men and 1 woman can be chosen)}}{{\text{Total \#ways 18 Cabinet members can be chosen from 114 candidates}}}$
Then, breaking it down:
$latex Pr(0\quad women)=\frac{\binom {89} {18}}{\binom {114} {18}}$
$latex \qquad =\frac{89*88*\dots*73*72}{114*113*\dots*98*97}$
$latex \qquad \approx 0.0076$
$latex Pr(1\quad women)=\frac{\binom {89} {17} *\binom {25} 1}{\binom {114} {18}}$
$latex =\frac{25*18*89*88*\dots*73}{114*113*\dots*98*97}$
$latex \approx 0.0473$
Therefore,
$latex Pr(No\quad more\quad than\quad 1\quad woman)$
$latex \approx 0.0076+0.0473\approx 0.0549$
$latex \approx 5.49\%.$